|
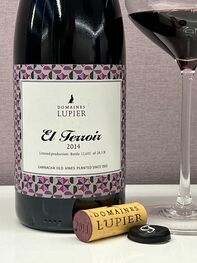
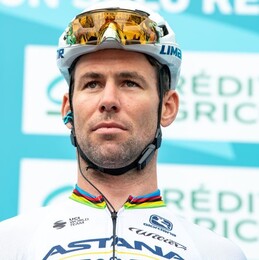
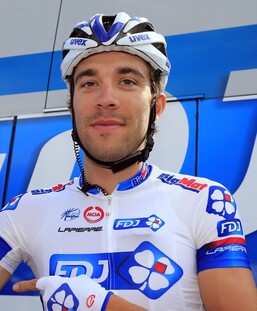
A well-aged wine to celebrate and reflect upon superstars and their last Tour de France. It was announced earlier this year that this would be the last Tour de France for Mark Cavendish, Peter Sagan, and Thibaut Pinot. These riders have changed the race over the last 15 years. To reflect on these riders I have chosen 2014 Domaines Lupier El Terroir, Navarra DO, in northern Spain. Navarra wine region is very close in proximity to Bilbao, the site of stage 1 for the 2023 Tour de France. This wine was produced in 2014 and made from grapes of 110+ year-old vines. An aged wine does not need to be expensive; it needs to have been created with the point of view that it can age in the bottle. The price for this wine was reported as $25 to $30. Time in the bottle allows the wine to integrate aromas, flavors, and textures; time to mature. That said, 95% of all wines are meant to be consumed at the time of release, this includes many wines that can age.
While enjoying my wine, I am reflecting on the joy and excitement Mark Cavendish, Peter Sagan, and Thibaut Pinot have given us in their years of racing. Three of the most notable riders in the modern era of the Tour de France. Their contributions will be talked about for years to come.
Cheers to these amazing racers! They have made indelible marks on the race. Each giving us excitement and stories to talk about for many years.
Santé 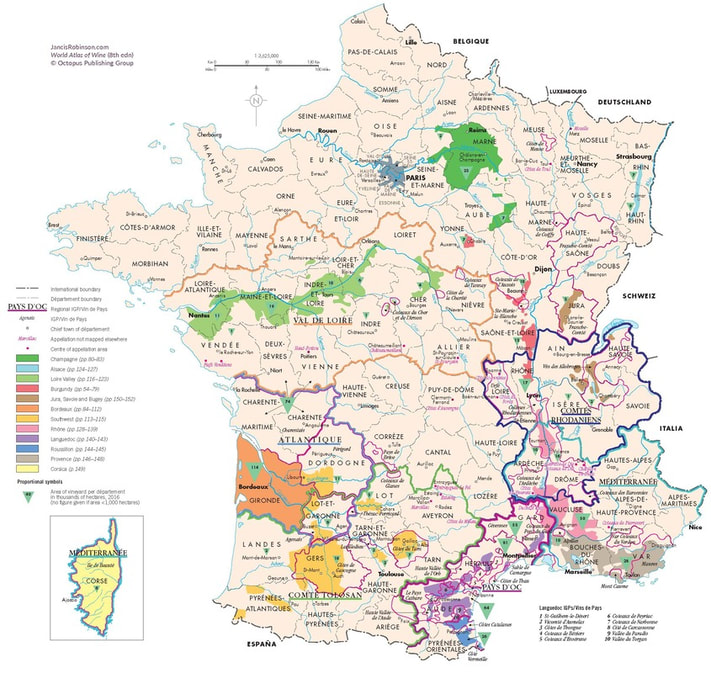 A bit about this upcoming blog and me… I am a wine enthusiast and avid traveler who has been watching the Tour de France for about 50 years. Several years ago I recognized that these passions overlapped while I was studying wine maps of France, maps of the race, and watching race coverage, which I have long considered to be a travelog adjacent to the race with amazing videos of many historical sites along the route of the Tour, including notable vineyards and wine chateaus. This blog is an attempt to combine my enthusiasm for wine, travel, and the Tour de France. Since this is a daily blog, I have decided to keep my posts short and sweet. So I have included links to experts who write about wine, travel, and the Tour de France. The links are my effort to share their expertise in case you want to conduct a deeper dive into any of these subjects. Besides the links within the post, I have also provided a resources page. I believe there are many wine regions along the race route of Tour de France that produce delicious wines, but many people do not know of these wines. Most of the wines are not the highly sought-after bottles that are covered in the worldwide media. These are wines for people who like to have a glass of wine with dinner or a celebration with friends. These are wines with character and substance that come from a very specific place. While I will highlight some of the high-profile wines because you can’t go through an area like Sauternes, in the wine region of Bordeaux, where they produce the extremely famous sweet dessert wine, and not mention Château d’Yquem. Please post your wine selections for each stage on my Instagram or add comments to the posts. Keep it civil, this is supposed to be fun! Santé Join me here during the month of July as we embark on a virtual wine adventure through some of the most important vineyards in the world while we watch the most important bicycle race in the world, the Tour de France. 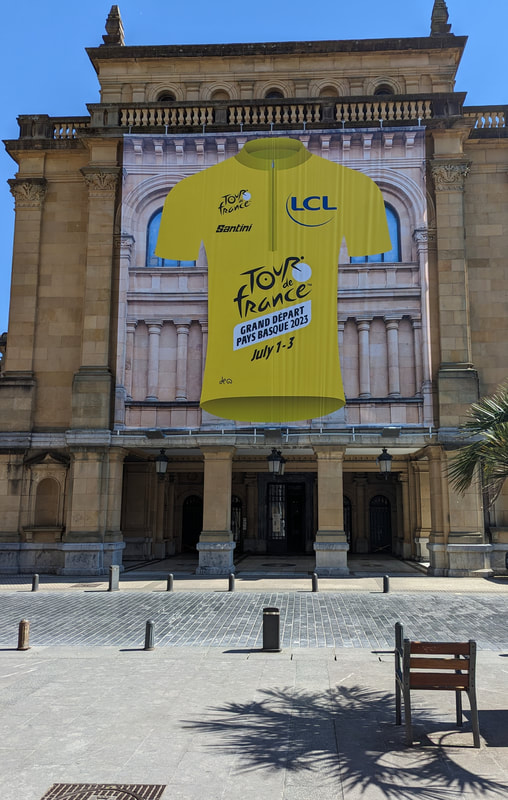 Tour de France 2023 Grand Depart. San Sebastian, Basque Region, Spain. © Lisa Kolick In this post I explain how to build the 5 Key Metrics, including calculations. Using your business data to develop these metrics will inform and validate your strategies, decisions, and processes to grow your winery, distillery, or brewery.
The 5 Key Metrics
Margins, by product (wine): You and your accountant will determine the cost of each product. In calculating the cost of each product, you should include all expenses used to manufacture and overhead (space, utilities, labor, etc.). Additionally, developing a separate cost basis for marketing and sales, including all expenses for each, creates a foundation upon which to grow your winery, distillery, or brewery. Knowing how much margin you can use to execute efficient and effective marketing and sales strategies helps you grow. Cost to Acquire a New Customer: Every business needs new customers to grow. Your loyal customers may sustain your business, but you cannot grow without new customers. What does it cost to get a new customer? This metric tells us if we are efficient in how we get new customers. To create this metric, you first define customer segments. Examples of these segments are:
Next, define the costs to get that customer, by channel, using your investment costs used in your strategies to acquire new customers. Examples:
An example of the formula for a tasting room is: (# Sample Bottles x Average Cost per Bottle)/ # of Customers = Cost to Acquire a New Customer in the tasting room Average Sale per Customer Type: Using your customer segments, as defined in the previous metric: Visitors, Guests, Customer, and Wine Club members, calculate the average purchase per customer in each of these segments. An example of the formula for segments is:
This data reflects the value within each customer segment and is the building block for the conversion progressions. Rate of Conversion Progressions: inform as to the rate at which visitors are converting to guests, guests to customers, and customers to wine club members within each sales channel. An example of the calculation is:
This metric validates the effectiveness of strategies used to convert visitors along the customer journey. Replicating effective strategies allows you to continue to find new customers. The # of Bottles Sold, per Employee, per Hours Worked: helps level set your sales staff, monitor sales results, and elicit questions for deeper understanding of your sales process, such as:
An example of this calculation is: # of Bottles Sold / # of Hours Worked per employee over a week, month, or year These metrics make your data consumable and actionable. They allow you to be agile and sell more wine. OPPORTUNITIES FOR SMALL WINERIES AND CRAFT ALCOHOL BEVERAGE BUSINESSES ARE FOUND IN THE DATA The artisan, craft winery community is in the midst of an extraordinary challenge. How do we find new customers with tasting room experiences dictated by stringent health and safety requirements and reduced patron capacity? Answers lay in the data from the creative events you have been conducting, newfound webstore traffic, and your sales data, this is where the opportunities reside. I am excited that there are avenues for small, artisan wineries to continue to grow their business during challenging times. Data is the window into winery and craft alcohol beverage businesses; it validates and informs decisions; it elevates confidence. Data shines a light in the darkness to help us see the next opportunity. That being said, data is not a magic elixir. Data requires time, thought, and effort to create usable data. It needs us to be focused and execute our plans. The results can be exciting or confirm our fears, but once we know, we can act. Data is exciting. 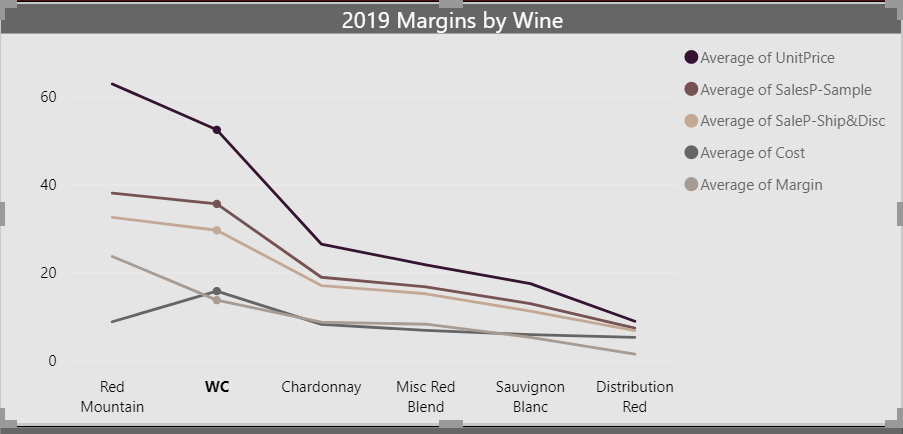 Sample chart: Impact of Samples, Shipping, and Discount on Margins by Wine Getting started is often the hard part. A person who works with large amounts of data recently said to me, “If I had known how much it took to get good data, I wouldn’t have done this work. Now that I have the data, I can’t live without it.” I write this not to scare you, but to inspire you to look at your data. You will see your situation for what it is and the possibilities for the future.
Grapes and Still Waters is here to help you develop these analytics for your winery or drinks business. We can help you structure your data gathering and create processes to make your data consumable and actionable. Now is the time to develop actionable plans for ‘OND,’ the most critical quarter in the wine and drinks business. Data can help your winery or drinks business remain viable during these extraordinary times. Grapes and Still Waters has had to pivot and become more focused due to the pandemic, just as all small wineries, distilleries, and craft brewers have had to change the way to find new customers and sell more wine. Our priority at Grapes and Still Waters is to help our community. We believe that data is the key. Large producers are using big data and AI to grow and remain viable. Grapes and Still Waters offers data services for small producers. Our priority is to help small wineries, distillers, and brewers grow and thrive. We provide data evaluations free of charge, and very cost-effective solutions to wineries and other drinks businesses, to aid their recovery from the shutdown. Drinks businesses that thrive during this extraordinary time will use Key Performance Indicators (KPI) to know if they are operating efficiently and effectively. Below are five KPIs we think are critical for your understanding: (Click on each KPI to go to video)
Watch our 5 Key Metrics videos to get a broader understanding of these KPIs. Below is a sample dashboard representation of the KPIs. Visualization makes data more consumable. Contact us today to learn more. 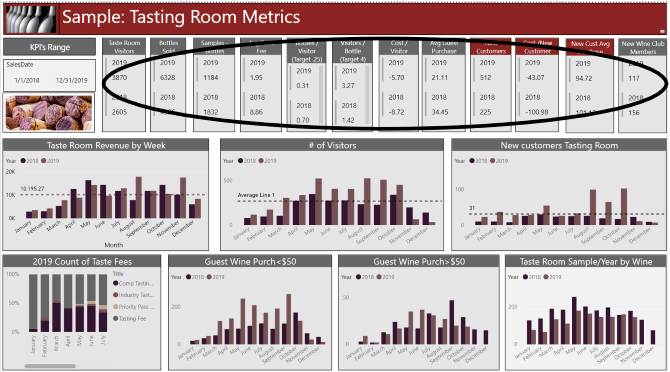 We want to keep drinking wines that are diverse and interesting. Small producers create these types of wine. We want to help our community survive and thrive. Contact us or call Lisa at 425.492.5755 to learn more. We work in western WA or remotely.
|