|
In this post I explain how to build the 5 Key Metrics, including calculations. Using your business data to develop these metrics will inform and validate your strategies, decisions, and processes to grow your winery, distillery, or brewery.
The 5 Key Metrics
Margins, by product (wine): You and your accountant will determine the cost of each product. In calculating the cost of each product, you should include all expenses used to manufacture and overhead (space, utilities, labor, etc.). Additionally, developing a separate cost basis for marketing and sales, including all expenses for each, creates a foundation upon which to grow your winery, distillery, or brewery. Knowing how much margin you can use to execute efficient and effective marketing and sales strategies helps you grow. Cost to Acquire a New Customer: Every business needs new customers to grow. Your loyal customers may sustain your business, but you cannot grow without new customers. What does it cost to get a new customer? This metric tells us if we are efficient in how we get new customers. To create this metric, you first define customer segments. Examples of these segments are:
Next, define the costs to get that customer, by channel, using your investment costs used in your strategies to acquire new customers. Examples:
An example of the formula for a tasting room is: (# Sample Bottles x Average Cost per Bottle)/ # of Customers = Cost to Acquire a New Customer in the tasting room Average Sale per Customer Type: Using your customer segments, as defined in the previous metric: Visitors, Guests, Customer, and Wine Club members, calculate the average purchase per customer in each of these segments. An example of the formula for segments is:
This data reflects the value within each customer segment and is the building block for the conversion progressions. Rate of Conversion Progressions: inform as to the rate at which visitors are converting to guests, guests to customers, and customers to wine club members within each sales channel. An example of the calculation is:
This metric validates the effectiveness of strategies used to convert visitors along the customer journey. Replicating effective strategies allows you to continue to find new customers. The # of Bottles Sold, per Employee, per Hours Worked: helps level set your sales staff, monitor sales results, and elicit questions for deeper understanding of your sales process, such as:
An example of this calculation is: # of Bottles Sold / # of Hours Worked per employee over a week, month, or year These metrics make your data consumable and actionable. They allow you to be agile and sell more wine. OPPORTUNITIES FOR SMALL WINERIES AND CRAFT ALCOHOL BEVERAGE BUSINESSES ARE FOUND IN THE DATA The artisan, craft winery community is in the midst of an extraordinary challenge. How do we find new customers with tasting room experiences dictated by stringent health and safety requirements and reduced patron capacity? Answers lay in the data from the creative events you have been conducting, newfound webstore traffic, and your sales data, this is where the opportunities reside. I am excited that there are avenues for small, artisan wineries to continue to grow their business during challenging times. Data is the window into winery and craft alcohol beverage businesses; it validates and informs decisions; it elevates confidence. Data shines a light in the darkness to help us see the next opportunity. That being said, data is not a magic elixir. Data requires time, thought, and effort to create usable data. It needs us to be focused and execute our plans. The results can be exciting or confirm our fears, but once we know, we can act. Data is exciting. 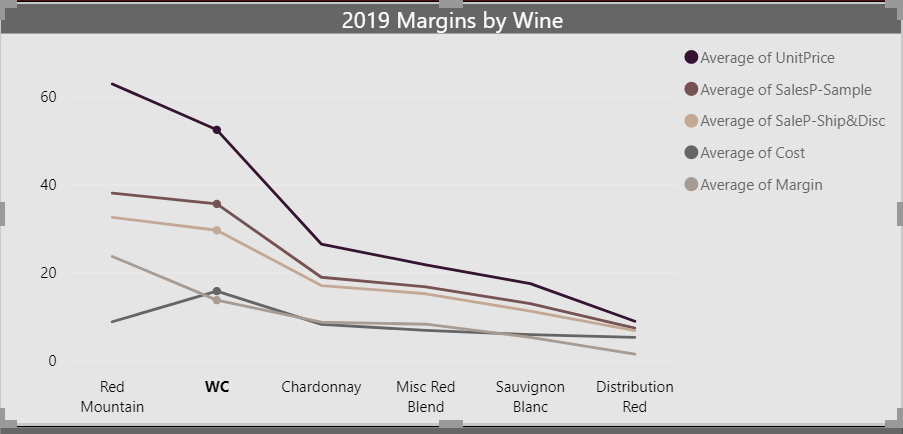 Sample chart: Impact of Samples, Shipping, and Discount on Margins by Wine Getting started is often the hard part. A person who works with large amounts of data recently said to me, “If I had known how much it took to get good data, I wouldn’t have done this work. Now that I have the data, I can’t live without it.” I write this not to scare you, but to inspire you to look at your data. You will see your situation for what it is and the possibilities for the future.
Grapes and Still Waters is here to help you develop these analytics for your winery or drinks business. We can help you structure your data gathering and create processes to make your data consumable and actionable. Now is the time to develop actionable plans for ‘OND,’ the most critical quarter in the wine and drinks business. Data can help your winery or drinks business remain viable during these extraordinary times. |